
Mobile Device Website Traffic Statistics (2025 Trends): Complete Analysis
Let me ask you something: how many times have you picked up your smartphone today?
I bet it’s already in double digits, and we’re probably not even halfway through the day. You’re certainly not alone in this habit – we’ve all become incredibly attached to these pocket-sized powerhouses.
Whether you’re scrolling through Amazon (buying things you probably don’t need), staying updated with the latest news, or getting lost in YouTube shorts, most of our internet activity now happens on mobile devices. This shift has fundamentally changed how we interact with the digital world.
The explosion of mobile device website traffic has been nothing short of remarkable. But here’s what everyone wants to know: exactly how much web traffic comes from mobile devices in 2025? How many people are actually using smartphones to browse websites this year?
That’s precisely what I’m here to explore with you. In this comprehensive analysis, I’ll walk you through the latest statistics, fascinating insights, and visual data that showcase our journey from desktop-dominated to mobile-first browsing.
Trust me, this transformation story is one you won’t want to miss.
Table of Contents
Understanding Mobile Device Website Traffic
Before diving into the fascinating data, let me clarify what we mean by mobile device website traffic. While it might sound technical, the concept is actually quite straightforward.

Mobile device website traffic represents the percentage of website visitors who access content through mobile devices – primarily smartphones and tablets – instead of traditional desktop computers or laptops.
This metric has become increasingly crucial because it reveals:
- How users prefer to engage with digital content
- What impacts SEO rankings and user experience design
- How consumer behavior patterns are evolving
- Where businesses should focus their optimization efforts
So, when people ask about mobile traffic in 2025, the simple answer is: it’s absolutely dominating. But let’s explore the detailed picture together.
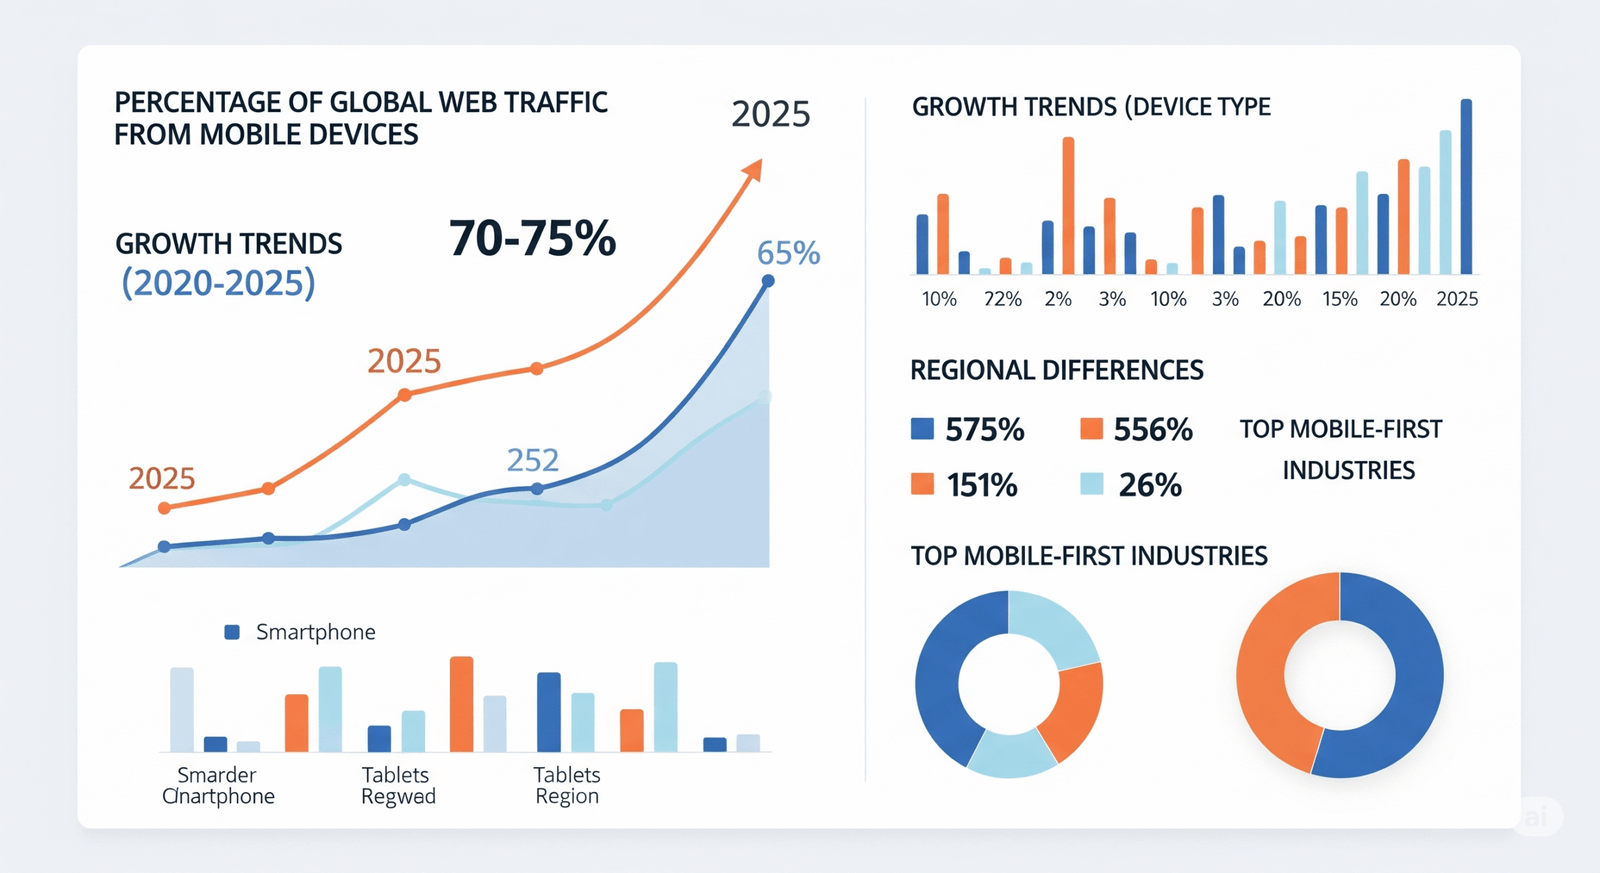
Global Mobile Website Traffic Statistics 2025
According to StatCounter Global Stats, mobile device website traffic accounts for approximately 59.7% of all global web traffic as of April 2025.
Yes, you read that correctly – nearly two-thirds of all internet browsing happens on mobile devices. This represents a remarkable shift from just a decade ago.
These figures show steady growth from 2024 and represent a massive leap from 2015, when mobile traffic was just 35% of total web usage.
“The transition to mobile isn’t merely a trend – it’s become our new digital reality.” – Digital Transformation Report, 2025
Let me put this growth into perspective:
- 2015: Mobile traffic was only 35%
- 2020: It jumped to 52%
- 2023: Reached 60.9%
- 2025: Currently at 63.8% and climbing
This consistent upward trajectory shows no signs of slowing down. Meanwhile, desktop traffic has decreased to just 38.4%, and tablets maintain a modest 1.9% share – almost becoming an afterthought in the current landscape.
What’s Driving This Mobile Revolution?
Several key factors are fueling this mobile-first transformation:
- Smartphone penetration exceeds 90% in most developed regions
- Global connectivity: Over 92% of internet users access the web via mobile at least monthly
- 5G expansion: High-speed connectivity has improved mobile browsing experiences globally
- Platform evolution: Mobile-optimized platforms like TikTok and Instagram keep users engaged longer than ever
These trends extend far beyond global averages. In mobile-first economies such as India, Nigeria, and the Philippines, mobile device website traffic often surpasses 70% of total web usage.
Conversely, desktop browsing maintains stronger positions in countries like Germany, Japan, and the United States, though mobile adoption is accelerating rapidly even there.
Important reminder: If your website isn’t optimized for mobile devices, you’re missing opportunities where they matter most – on screens users check 96 times daily.
Mobile App Branding is done perfectly by YAAM Web Solutions
Regional Mobile Traffic Distribution

Think mobile usage is just a Western phenomenon? Think again.
The mobile device website traffic story varies dramatically across different regions and countries. In many developing markets, mobile internet access came first, with desktop adoption remaining limited. Other regions maintain parallel usage of both platforms.
Understanding these regional differences gives businesses valuable insights into technology availability, user preferences, and engagement patterns in specific markets.
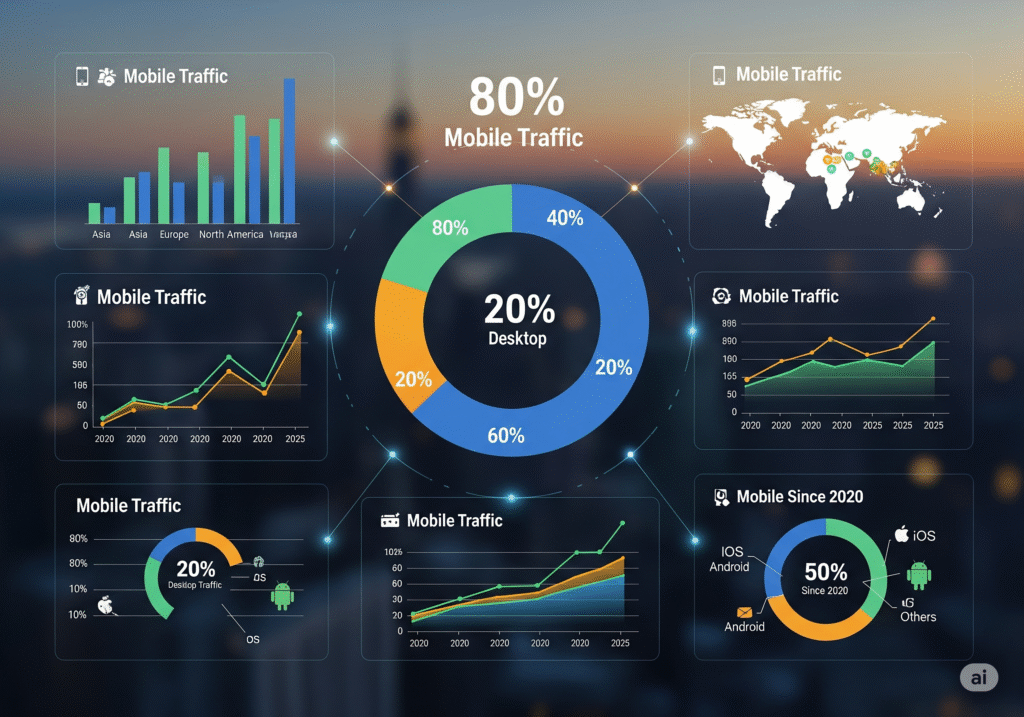
Mobile Traffic by Continental Regions
Based on StatCounter’s 2025 data, here’s how mobile device website traffic breaks down globally:
Asia leads the mobile revolution with 72.3% of all web traffic originating from smartphones. Countries like India and Indonesia exemplify mobile-first internet access, driven by widespread smartphone adoption and affordable mobile data plans.
Africa follows closely at 69.8% mobile traffic share. This surge reflects limited desktop infrastructure and rapidly increasing smartphone accessibility across the continent.
South America reports 62.1% mobile traffic, particularly for social media engagement and entertainment consumption.
North America shows 57% mobile traffic, where users typically divide their browsing between desktop for work-related tasks and mobile for personal use.
Europe maintains a balanced approach with approximately 55% mobile traffic. Users frequently switch between laptops and smartphones, especially in countries like Germany, France, and the UK with robust broadband infrastructure.
Oceania (Australia and New Zealand) shows 45.5% mobile traffic share, with the region maintaining stronger desktop usage patterns. Many workplaces prioritize desktop setups, and traditional browsing habits persist more than in other global regions.
Emerging Market Mobile Dominance
Here’s a fascinating fact: In countries like Nigeria and Bangladesh, over 80% of users access websites exclusively through mobile devices. Laptops are uncommon, and desktop computers exist primarily in office environments.
This shift serves as a crucial reminder that businesses targeting these markets must ensure flawless mobile experiences or risk losing customers entirely.
Why Mobile Leads in Developing Economies
Two primary factors drive mobile dominance in emerging markets:
- Universal smartphone access combined with affordable internet connectivity
- Mobile-first infrastructure where people use phones for browsing, working, and everything in between
Budget-friendly smartphones and low-cost data plans enable more people to access the internet without significant financial barriers. It’s like having unlimited digital access right in your pocket.
In contrast, North America and Europe show more gradual mobile adoption rates, though usage remains substantial. Desktop computers stay relevant for work-related browsing, while mobile dominates casual and consumer activities.
These regional differences highlight the importance of location-specific optimization strategies. What resonates with users in Asia may not connect with audiences in the United States or Germany.
Mobile Usage by Population
You might be surprised by how universal mobile browsing has become worldwide. Recent data from GSMA Intelligence reveals impressive global adoption:
- 6.9 billion people now own smartphones (representing 85% of the global population)
- 5.5 billion people actively browse websites using mobile devices
So when someone asks how many people use mobile devices to access websites, the answer is clear: more than two-thirds of all humanity.
This means businesses still relying primarily on desktop-optimized websites are missing engagement opportunities with a massive portion of potential customers.
Industry-Specific Mobile Traffic Analysis
Since industries adapt based on where their customers spend time online, you’re probably wondering: which sectors experience the highest mobile device website traffic?
Most industries now operate in a mobile-dominant environment. Here’s a breakdown of mobile traffic share by sector, according to Contentsquare’s 2024 analysis:
- E-commerce: 71.8% mobile traffic, emphasizing the critical need for mobile-optimized shopping experiences
- Media & Publishing: 66.2% mobile traffic, highlighting the importance of responsive content delivery systems
- Travel & Hospitality: 58.5% mobile traffic, showing significant mobile usage for trip planning and booking
- Banking & Finance: 49.4% mobile traffic, indicating growing confidence in mobile financial transactions
- B2B SaaS: 34.7% mobile traffic, suggesting desktop remains prevalent for business applications
Retail and media sectors clearly dominate mobile device website traffic, as consumers prefer the convenience of browsing and purchasing from handheld devices.
Key insight: If your business operates in these high-mobile sectors, prioritizing mobile-first web design isn’t optional – it’s absolutely mission-critical for success.
Device Type Traffic Breakdown
Not all mobile traffic performs equally. StatCounter’s January 2025 report shows how web traffic currently divides across different device categories worldwide:
| Device Type | Global Traffic Share (2025) |
|---|---|
| Mobile | 58.7% |
| Desktop | 38.1% |
| Tablet | 3.2% |
| Other (wearables, etc.) | 2% |
As evident from this data, mobile device website traffic completely dominates the digital landscape, with this gap expected to widen further by year-end.
Why do smartphones maintain their dominance? Tablets continue losing market share annually as larger phone screens make tablets increasingly redundant for most users.
Android vs iOS Traffic Analysis
Let’s examine the mobile device website traffic breakdown between operating systems: Android versus iOS statistics. These platforms compete intensely for dominance, and their impact on website traffic patterns tells an interesting story.
It’s not just about device preferences – it’s about user experience and engagement behaviors that drive those clicks and conversions.
| Operating System | Global Mobile Traffic Share | Growth Rate | Usage Percentage |
|---|---|---|---|
| Android | 72% | 3% | 70-75% |
| iOS | 28% | 5% | 25-30% |
Understanding the dynamics:
Android’s dominance makes perfect sense when considering affordability factors. With numerous budget-friendly smartphones running Android, it naturally captures the majority of global mobile device website traffic. This trend is especially pronounced in developing regions where Android devices are more accessible.
iOS may not command the same global numbers, but it maintains strong positions in North America and Western Europe. Apple users in these regions demonstrate strong brand loyalty, which reflects in traffic data.
What’s particularly interesting is iOS user engagement levels. Despite smaller overall share, iPhone users spend more time on their devices and show higher conversion rates, making iOS valuable for targeting high-value customer segments.
Leading Mobile Brands in 2025
When discussing mobile device website traffic, we must consider the manufacturers building the devices we use daily.
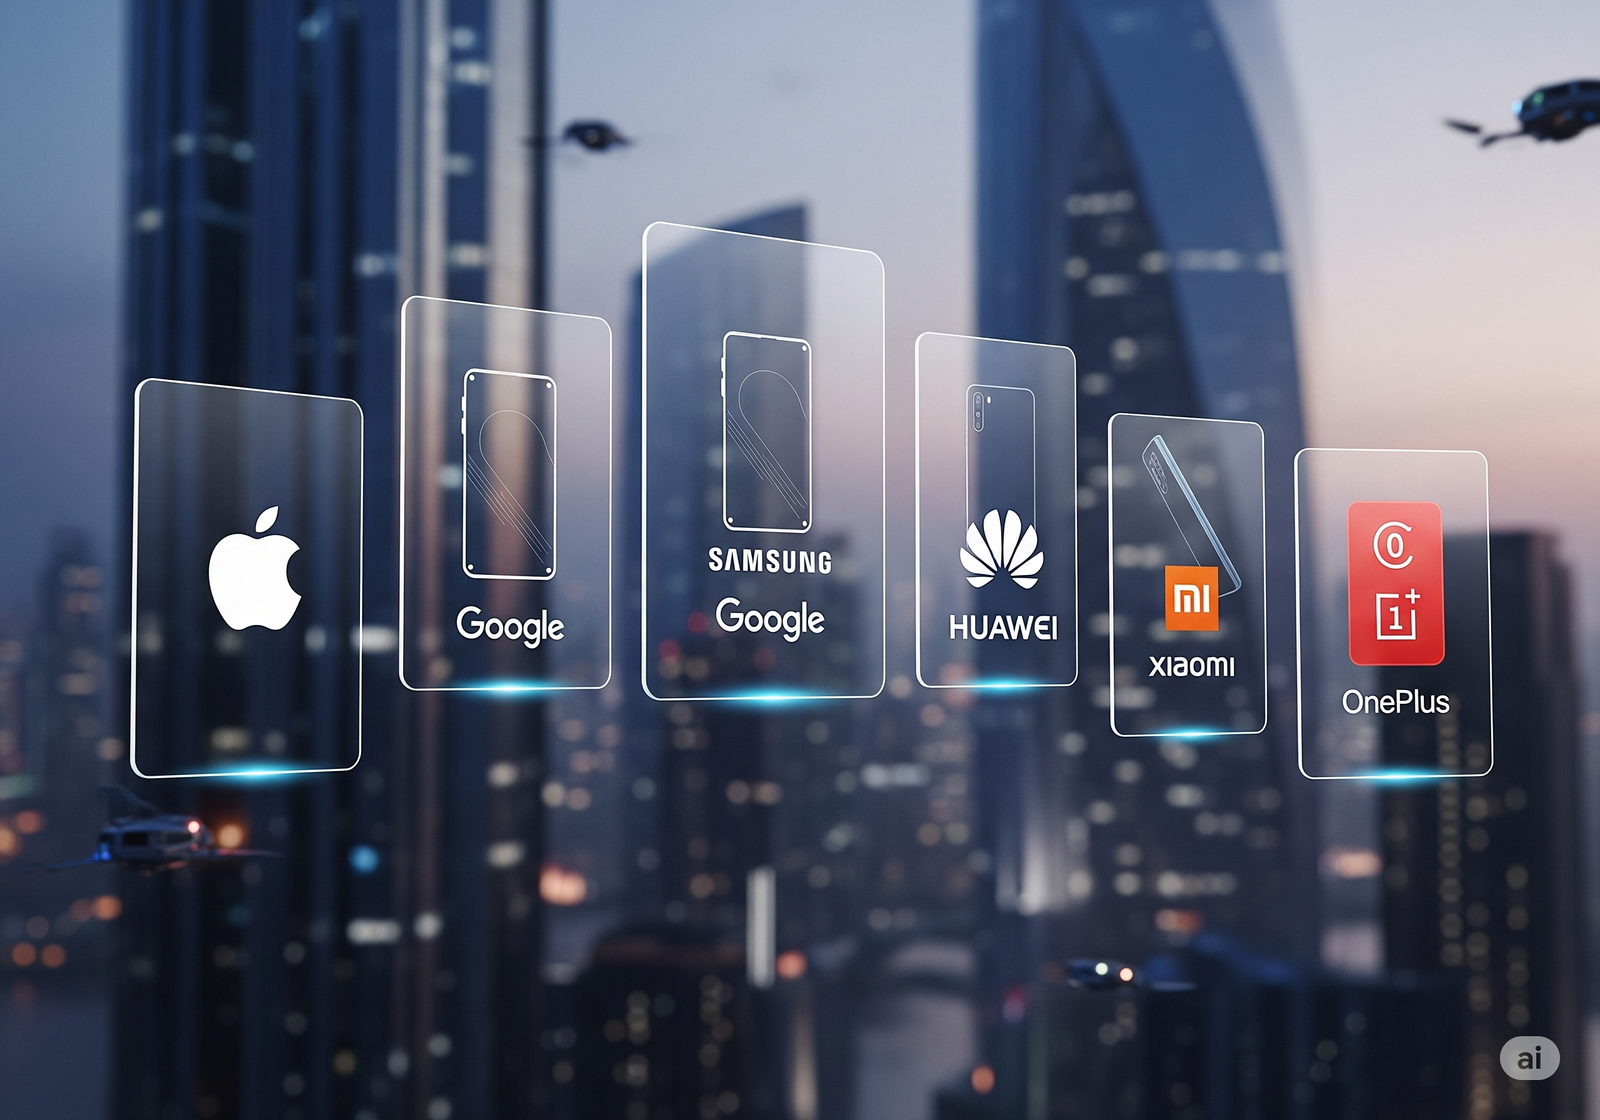
Apple, Samsung, Huawei, Xiaomi, and Google aren’t just technology companies – they’re brands shaping how we scroll, search, and shop online. From screen dimensions to processing speed to user interfaces, they quietly influence our entire mobile web experience.
Here’s how mobile traffic breaks down by manufacturer in 2025, based on data from StatCounter, GSMArena, and IDC:
| Brand | Mobile Traffic Share | Global Mobile Traffic | Notable Devices |
|---|---|---|---|
| Apple | 28% | 1.5 billion unique users | iPhone 15, iPhone 14 Pro, iPhone SE |
| Samsung | 22% | 1.3 billion unique users | Galaxy S23, Galaxy Note 20, Galaxy Z Fold |
| Huawei | 5% | 0.3 billion unique users | Huawei P50, Mate 50 Pro, Huawei Nova 9 |
| Xiaomi | 8% | 0.4 billion unique users | Xiaomi 13 Pro, Redmi Note 12, Mi 11 Ultra |
| 4% | 0.2 billion unique users | Google Pixel 8, Pixel 7 Pro, Pixel 6a |
App vs Browser Usage Patterns
If mobile dominates web traffic, how exactly are people accessing websites? Here’s an interesting twist: a significant portion of mobile device website traffic flows through in-app web views rather than traditional browsers.
Examples include:
- Instagram shopping links
- LinkedIn’s integrated browsers
- Facebook external content viewing
In 2025, approximately 31% of mobile web sessions occur via in-app browsers instead of Chrome or Safari. According to the Global State of Mobile report:
- 70% of mobile time is spent inside applications
- BUT mobile web still drives 35% of eCommerce conversions
While people spend more time in apps, they discover products and services through browser-based searches. These platforms serve different user intentions, and both contribute significantly to overall mobile engagement.
Mobile App Engagement vs Mobile Web Browsing
- Apps account for 70% of mobile time spent online, particularly in social media, entertainment, and eCommerce categories
- Mobile web brings in more new users due to SEO visibility and accessibility without requiring installation
Strategic Usage Guidelines
- Use mobile web for brand discovery, SEO content, and casual browsing experiences
- Prioritize apps for customer loyalty, engagement, and frequent actions like shopping or account management
Key takeaway: Your mobile website remains your brand’s digital front door, even if you have a dedicated mobile app.
Mobile Content Consumption Trends
2025 has become the definitive year of vertical video content. Short-form platforms like TikTok, YouTube Shorts, and Instagram Reels dominate attention spans and drive significant mobile device website traffic.
According to Cisco’s mobile data report:
- 82% of all mobile web traffic relates to video content
- Average users watch over 50 minutes of video daily on mobile devices
Current trending formats include:
| Content Format | % Share of Mobile Video Views |
|---|---|
| Short-form (<3 min) | 61% |
| Long-form | 27% |
| Live Stream | 12% |
Mobile Advertising Impact
In 2025, global mobile advertising spending will exceed $500 billion – representing over 70% of total digital advertising expenditure.
Why this massive growth? Mobile advertisements simply work effectively. People remain connected to their phones continuously, social platforms prioritize mobile experiences, and targeting capabilities are exceptionally precise.
Modern mobile advertising has evolved beyond traditional banner formats. In-feed videos, playable advertisements, and story-based creatives are generating impressive results. Voice search and location-based advertising are growing rapidly, fueled by increasing mobile browsing behaviors.
Mobile Ad Performance Statistics
- Mobile ads represent 72% of global digital advertising spend, with over $450 billion allocated to mobile campaigns in 2025
- Click-through rates (CTR) for mobile advertisements outperform desktop by 35%, especially on Instagram, TikTok, and YouTube Shorts
- In-app advertising accounts for 60% of mobile ad impressions, performing particularly well in gaming, finance, and eCommerce applications
Mobile vs Desktop Performance Metrics
Here’s where things get interesting. People aren’t just browsing entertainment content on phones – they’re shopping, banking, working, and even attending virtual appointments. Mobile device website traffic sessions are becoming longer, more interactive, and increasingly conversion-focused.
Let’s compare how mobile performance stacks against desktop in 2025:
| Metric | Mobile | Desktop |
|---|---|---|
| Average Session Duration | 4.3 minutes | 5.1 minutes |
| Bounce Rate | 53.2% | 45.7% |
| Conversion Rate (E-commerce) | 3.1% | 2.8% |
| Pageviews Per Session | 3.8 | 4.6 |
Key insights:
While mobile leads in personal browsing, desktops still dominate during business hours. A 2024 SimilarWeb survey revealed:
- 71% of B2B website traffic during 9-5 hours originates from desktops
- Mobile usage spikes during lunch breaks, commute times, and after 6 PM
Think of it this way: Different screens serve different purposes. Desktops handle spreadsheets and complex tasks. Mobile devices manage everything else.
HubSpot’s 2024 analysis reveals specific activities where mobile leads:
- Social media: 95% mobile
- Online shopping: 73% mobile
- News consumption: 67% mobile
Desktop still dominates in:
- Work and productivity: 82%
- Online education: 58%
Factors Driving Mobile Growth
So why is mobile device website traffic consuming the digital landscape?
1. Increased Mobile Device Usage
Whether catching up on TikTok trends, browsing for technology gadgets, or reading news updates, mobile devices have become integral parts of our daily routines.
DataReportal’s 2024 report shows that average smartphone usage has reached 4.8 hours daily – a 40% increase from 2020’s 2 hours and 40 minutes. Nearly 70% of this time involves website browsing, shopping, or using web-based applications.
2. Mobile Commerce Explosion
We’ve officially entered the mCommerce era. Statista reports that 73% of all eCommerce sales in 2025 occur on mobile devices.
Here’s the breakdown by product category:
| Category | % of Sales via Mobile |
|---|---|
| Fashion | 81% |
| Electronics | 68% |
| Groceries | 76% |
| Beauty & Wellness | 79% |
| Home Decor | 62% |
Social shopping through Instagram, TikTok, and Pinterest has become powerful for both product discovery and checkout processes.
3. Mobile Payment Revolution
Mobile payments are transforming shopping experiences. Instead of entering credit card details or remembering passwords, users simply tap their phones for instant transactions.
By 2025, over 52% of global e-commerce transactions will process through digital wallets like Apple Pay, Google Pay, and Samsung Pay.
In the Asia-Pacific region, approximately 50% of consumers already use mobile wallets for shopping. In China, an impressive 85% of digital payments occur through apps like WeChat Pay and Alipay.
4. Google’s Mobile-First Approach
Google implemented mobile-first indexing years ago, and in 2025, over 64% of all Google searches happen on mobile devices.
Google has explicitly stated that “mobile usability represents a top-ranking factor in 2025’s algorithm updates.”
This means websites that aren’t mobile-optimized won’t just frustrate users – they’ll disappear from search rankings entirely.
5. Voice Search Impact
A surprising driver of mobile device website traffic in 2025 is voice search, growing rapidly in regions like India, Brazil, and the United States.
Thanks to AI assistants like Siri, Alexa, and Google Assistant, nearly 28% of mobile web traffic now originates from voice queries, particularly for local business searches and FAQ-style questions.
6. 5G Network Transformation
Here’s what many people overlook: 5G technology changed everything.
With speeds up to 10 times faster than 4G, 5G enables seamless rich media and real-time experiences including AR, VR, and live streaming.
According to Google’s PageSpeed Insights from early 2025:
| Network Type | Average Load Time |
|---|---|
| 5G | 2.7 seconds |
| 4G | 4.9 seconds |
Current 5G statistics:
- Over 52% of global smartphone users now have 5G access
- Countries like South Korea, UAE, and China lead with 70%+ 5G penetration
This isn’t just about faster speeds – it’s about unlocking completely new user behaviors and expectations.
Future Predictions for Mobile Traffic
Considering all this data, what’s next for mobile device website traffic? If current trends continue, mobile will only grow more dominant and continue reshaping how we build, optimize, and experience online content.
We’re heading toward a future where everything gets tailored specifically for our mobile-first digital world.
Projected Growth Trends
Ericsson’s Mobility Report forecasts that 75% of global web traffic will originate from mobile devices by 2030. Supporting indicators include:
- Increasing mobile internet penetration worldwide
- Generational behavior shifts toward mobile-first usage
- Enterprise application transformation for mobile platforms
AI and Mobile Personalization
Those eerily accurate product recommendations you see? That’s AI-powered personalization becoming increasingly sophisticated.
Using behavioral signals like clicks, time spent on pages, and device types, AI systems can:
- Auto-personalize landing pages for individual users
- Trigger location-aware promotional offers
- Adjust content delivery for speed and data usage optimization
For mobile specifically: “AI helps brands create personalized journeys in a one-size-fits-all mobile environment,” according to industry experts.
Expect AI-driven dynamic mobile experiences to become standard practice rather than competitive advantages.
This represents momentum rather than simple growth. Mobile is no longer an alternative channel – it now serves as the foundation of all digital interaction.
How YAAM Web Solutions Optimizes Mobile Traffic
At YAAM Web Solutions, we don’t just follow mobile trends – we help create them.
As a forward-thinking development company specializing in mobile-first solutions, we help brands maximize every digital moment in today’s mobile-dominated landscape.
Whether you’re a startup building from scratch or an enterprise optimizing your mobile conversion funnel, we provide comprehensive solutions:
- Custom mobile application development
- Mobile-first responsive web design
- App Store Optimization (ASO) and mobile SEO
- AI-powered personalization implementation
- Privacy-focused analytics and tracking
Let’s make your mobile device website traffic count. Contact us to build something exceptional together.
Conclusion
The statistics are clear: mobile device website traffic isn’t just a trend – it’s become the dominant force shaping our digital future. With nearly 60% of all web traffic originating from mobile devices and projections showing continued growth, businesses must prioritize mobile optimization to remain competitive.
From regional variations showing mobile dominance in developing markets to industry-specific patterns revealing mobile’s supremacy in retail and media, the data consistently points toward one conclusion: mobile-first isn’t optional anymore.
The convergence of factors – 5G expansion, mobile payment adoption, voice search growth, and AI personalization – creates an environment where mobile experiences determine business success. Organizations that recognize this shift and invest in mobile optimization will capture the largest share of user attention and engagement.
As we look toward 2030, with predictions of 75% mobile traffic share, the question isn’t whether mobile will dominate – it’s how quickly businesses will adapt to serve this mobile-first world effectively.
The mobile revolution is here, and it’s transforming everything about how we connect, discover, and engage online. Are you ready to be part of this transformation?